The number of homeowners selling their properties within two years of purchase has jumped from 2% of sales in May 2022 to 3.7% of sales a year later. This suggests that many buyers took advantage of the low interest rates as the market provided relief during Covid, only to find they could not afford mortgage repayments as interest rates normalised.
In days gone by, distressed sales were easier to measure as bank repossessions were sold on auction and the market was alerted by Sales in Execution (SIE) notices published in the Government Gazette. Today Banks try to avoid the SIE route and have put alternative processes in place to assist owners to sell their properties when they need to, in an effort to avoid big losses for both the homeowners and the bank.
Taking the above into account, Lightstone measured property sales volumes, the number of properties bonded and the number of sales within two years of purchase, to determine whether the number of distressed sales are rising or not.
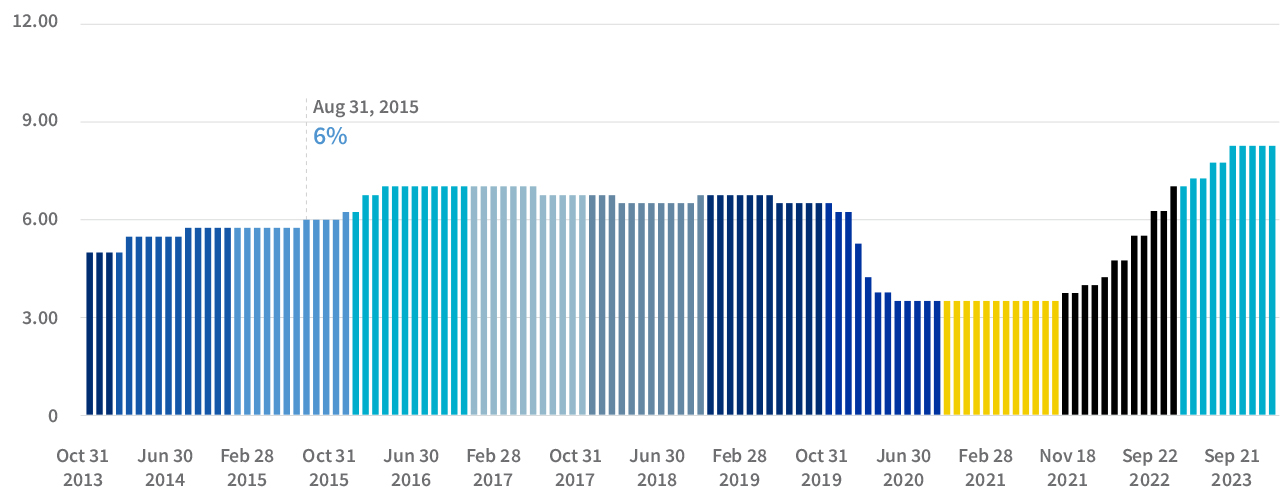
The exceptionally low interest rate environment from mid-2020 to end 2021 created an opportunity for new buyers to enter the market or for existing homeowners to buy up – but it also created the possibility of too many buyers overstretching themselves.
Interest rate fluctuation from 2013 - showing the lowest point from mid 2020 to end 2021

The volume of residential purchases by natural persons (not companies or trusts) halved from May 2022 to May 2023, and only 40% of buyers bonded their properties in May 2023 compared to 60% in 2022. This tells us that there were less buyers in the market, and when they did buy, they were less likely to bond their purchases.
To illustrate the point: there would have been 60 bonds for 100 sales in May 2022, but there were just 20 bonds for 50 sales in May 2023.
Having established that volumes and bonds are down, Lightstone looked at how many buyers were selling properties within two years to measure the level of “distressed sales” and compared May 2022 with May 2023 – and found that 80% more of those who bought in the middle of the low interest period, May 2021, were sellers by May 2023.
The example illustrates how an “event” like the low interest cycle, led to a problem emerging which was only visible later, when those struggling to pay bonds had sold and the data had fed into the Deeds Office numbers.

